Your whole financial life,
modeled and optimized.
A retirement optimizer you run yourself. Model your salary, property, debt, taxes, insurance and actual spending together, year by year, to age 90 and beyond. Answer one plain-English question at a time, each explained before you answer it. Then optimize across seven strategies at once, from when to claim Social Security to which accounts should hold your bonds. And if the plan still runs out of money, see exactly what would fix it.
- 81
- SS claiming combinations
- 7
- optimizer phases
- 50
- states + DC
- 1928
- earliest backtest year
Every dimension of your finances, modeled.
Built for the full complexity of real financial lives, not oversimplified.
Year-by-year projections
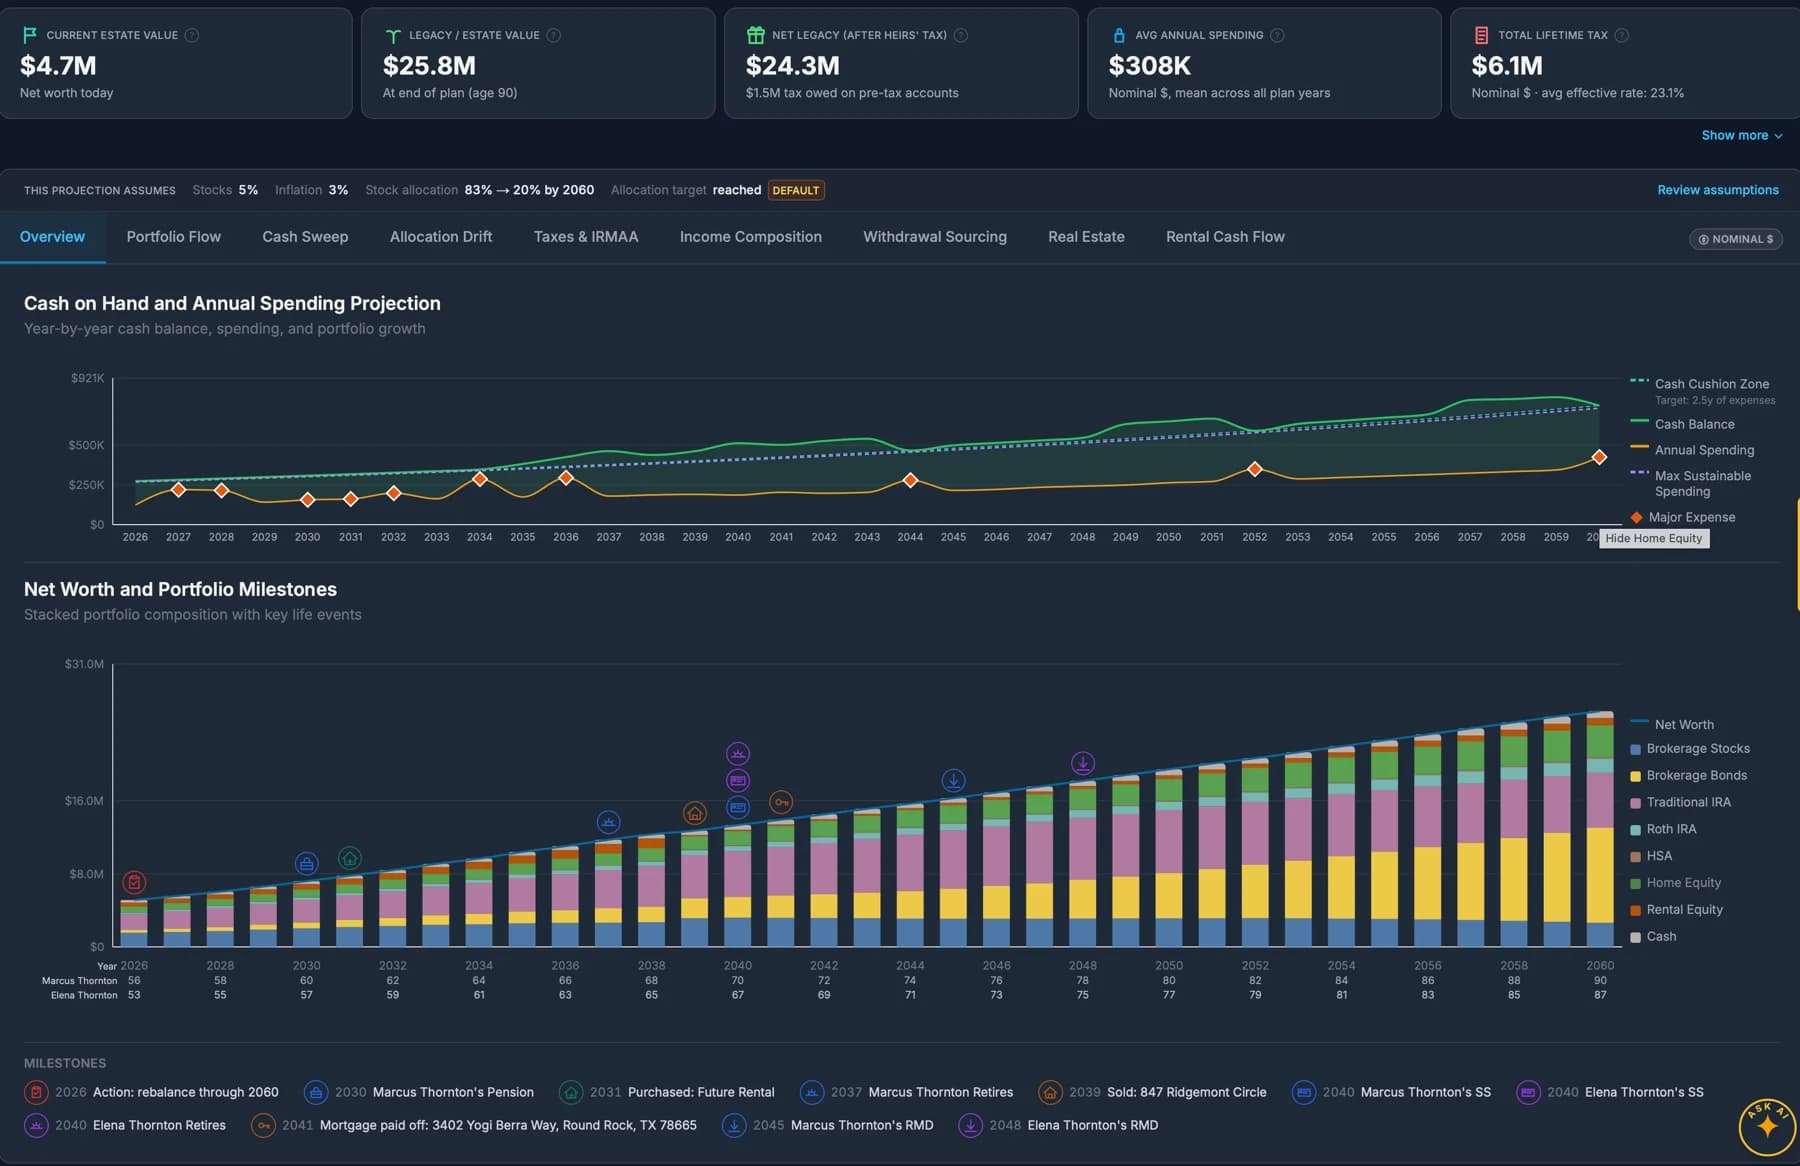
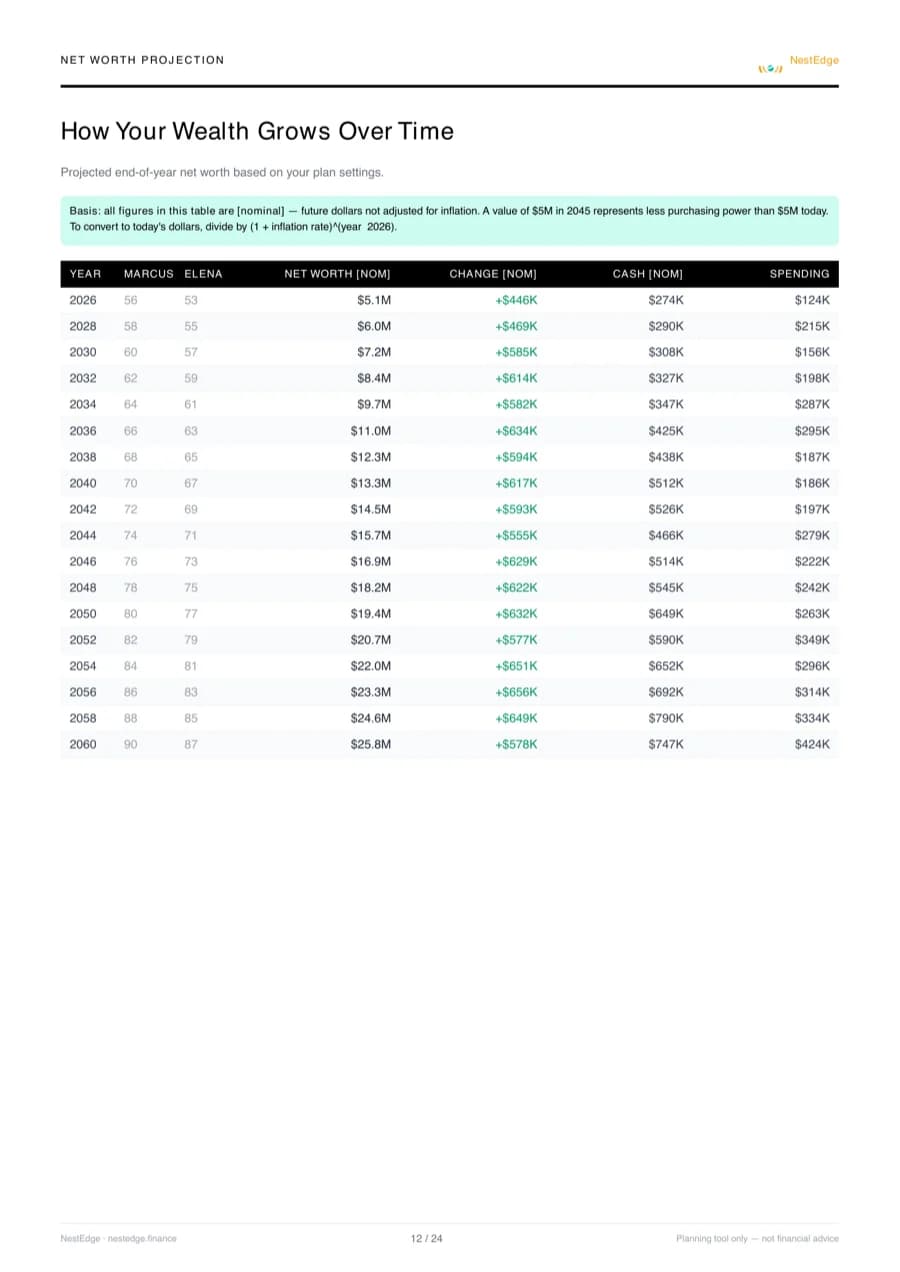
Net worth, cash flow, taxes, and spending tracked to age 90+ in a single clear chart. Toggle between nominal and today's dollars. Auto-generated insights surface depletion risk, IRMAA exposure, and Roth conversion windows.
Guided interview: one question at a time
Not sure where to start? The guided interview asks one plain question at a time, explains why it matters and what a typical answer looks like, and fills in a sensible default you can accept or change. It skips what does not apply to you, so a retired spouse never sees a 401(k) question. Every answer lands in the same plan the full form editor uses, and you can switch between the two at any point.
Plan Optimizer
Seven-phase coordinate descent evaluating 10,000+ combinations: retirement date, all 81 SS claiming ages, Roth conversion ceiling and pace, charitable QCDs, rental property sale timing, which of your accounts holds the stocks and which holds the bonds, and how fast to move to your target mix. Each is ranked by net legacy (what your heirs actually keep after the income tax embedded in pre-tax accounts) + longevity/survivor value. Any phase that isn't relevant to you can be switched off. And when none of that is enough, it says so and hands over to the runway ladder below.
Runway rescue: when the plan runs out, what would fix it
Timing and tax moves can only rearrange the money you have. If the optimized plan still runs dry, NestEdge measures the hard choices on your actual plan: spend less (and exactly how much), retire later, work part-time, sell the home and rent, downsize, take a reverse mortgage, sell a rental sooner, drop a planned expense, hold more in stocks. Each lever shows the year it buys you and whether it reaches the horizon, alone or in combination, previewable on every chart with a tick. Alongside it, a Safe to spend figure: the most this plan can carry every year, in today's dollars.
NestScore: your plan's vital signs
The moment your wizard is complete, before running a single simulation, your plan is rated on a five-tier scale from Bare to Soaring, so you know where you stand in seconds.
An action plan, not just a projection
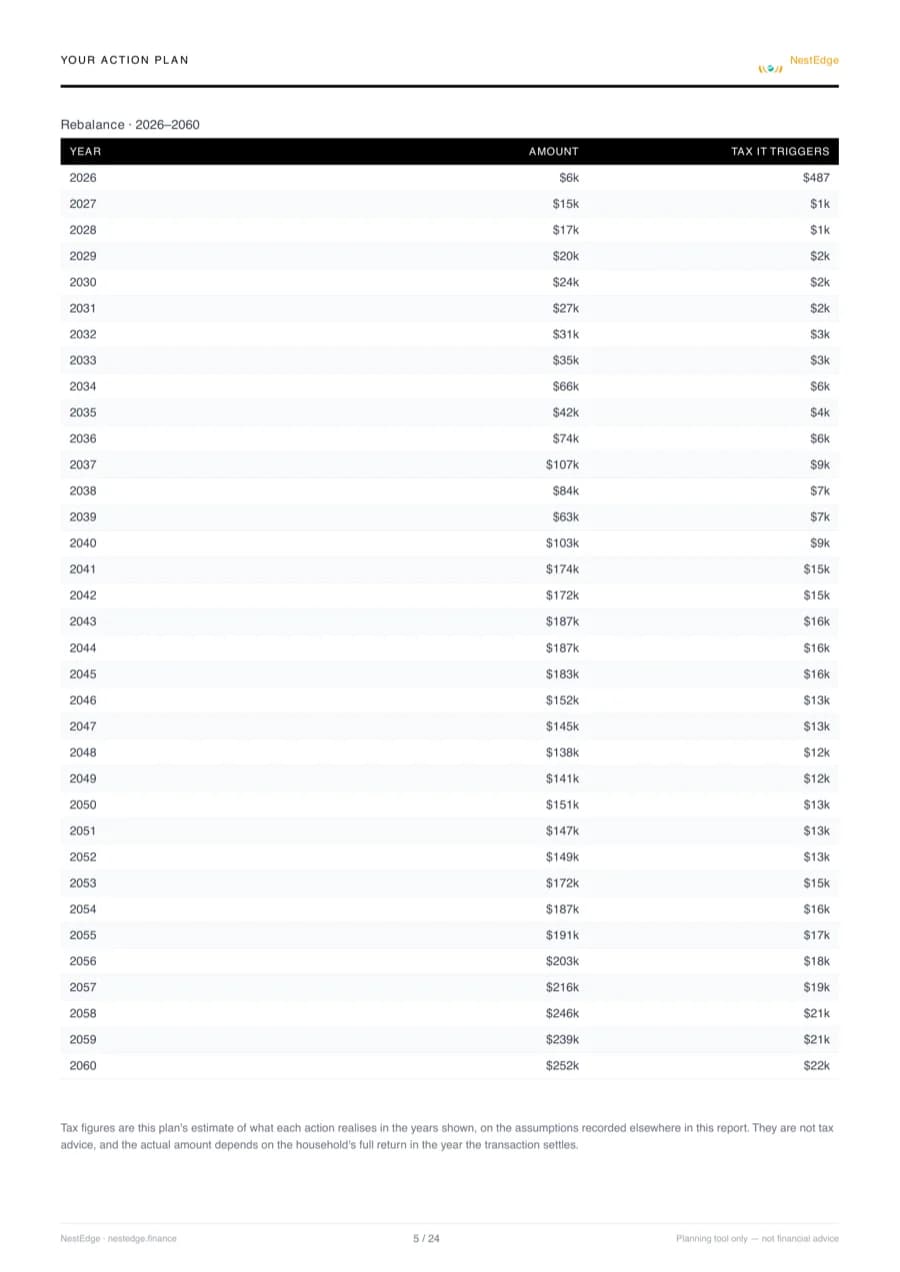
A projection is only worth what actually gets executed. Every action your plan depends on is listed: sell this much stock, convert this much to Roth, sell this property, each with the year, the amount, the account it comes from, and the tax it triggers; marked on the charts at the year it happens; and printed year by year in the PDF. NestEdge never moves your money. It tells you exactly what to do and when, to act on yourself or to hand to an advisor if you use one, then checks back later to ask whether it happened.
Close each year: see how it really went
When a year ends, a short year-end check-in records your December 31 balances and what you spent, with spending filled in from your Expenses if you track them. The plan then starts from where you actually are, and the year is kept: the charts show your last five years as they happened, beside what the plan expected, and every closed year is in a table, the PDF and the spreadsheet export. Your advisor sees when a year is due, and a correction made later is kept with who made it.
Your advisor's method, run for real
Total return with a cash buffer is the default. If your advisor runs a bucket strategy, choose it and the projection follows it: a two-bucket approach that refills the spending bucket only when stocks close at a new high, or a three-bucket approach with a Cash bucket, an Income bucket of bonds and a Growth bucket at your target mix. Set how many years each bucket holds, which accounts your advisor manages, and how held-away accounts are drawn. The Cash reserve view replays every year of the buckets, the report names the method on its cover, and Your Actions says what to move and why. Firms can make their method the default for every client plan.
Monte Carlo simulation
1,000 stochastic futures with Box-Muller market sampling. P10–P90 percentile bands on the net worth chart, a portfolio survival rate, and a worst/best-decile range. Runs as an async job so the UI never blocks.
Historical backtest: a century of real markets
Replay your plan through every real retirement start year back to 1928, covering the Depression, 1937, 1970s stagflation, 2000 and 2008, using the actual stock and bond return sequences that followed (Damodaran / NYU Stern data). Optionally drive living expenses by each era's real CPI, see how many historical retirements your plan survives, and overlay any single start year to compare against your plan. Not a simulation: real history.
Reconcile spending with your plan
Bridges the Budgeting module and your plan: one click compares your plan's living-expenses assumption against your real categorized budget, nets out what the plan already models separately (healthcare, housing, education, one-time spikes), flags taxes, and lets you preview or adopt the reconciled figure as an "Actual Spending" scenario, with full control over every inclusion.
Social Security: all 81 scenarios
Every claiming combination (age 62–70 × spouse 62–70) scored by NW + longevity/survivor value. Earnings Test & ARF, RIB-LIM, survivor benefits both ways, WEP/GPO removed (Fairness Act 2025), trust-fund insolvency what-ifs. SSDI (disability) modeled at full PIA with no early-claiming reduction, converting seamlessly to a retirement benefit at FRA.
Roth conversions, backdoor & mega backdoor
Bracket-ceiling optimizer that finds exactly where the marginal rate stops paying, with IRMAA torpedo zone detection, front-loaded vs. uniform pacing, the Roth 5-year clock and full RMD interaction. Backdoor Roth IRA with the IRS pro-rata rule (Form 8606) and per-person pre-tax IRA basis; mega backdoor through an after-tax 401(k) sub-account with basis/earnings split and §415(c) awareness. Suggests the conversion when you are eligible.
Deferred compensation (NQDC / §409A)
Non-qualified deferred comp payouts modeled with correct tax treatment: income tax due, FICA already accounted for at deferral (never double-counted), and the 20% excise-tax risk on a plan-modification violation.
Real estate & rentals
Primary residences, rental properties with MACRS depreciation, §1250 recapture, LTCG, NIIT, §1031 like-kind exchange with boot calculation for partial and N→M multi-property exchanges, optimizer-driven sale timing, and a per-property cash-flow breakdown showing exactly where each rental's rent goes.
State income tax across all 50 states
Every state + DC modeled with per-state retirement income exemptions for Social Security, civilian pensions, military retirement pay, and RMDs. Rules sourced from 2026 data and stored in an annually-updatable file.
AI Chat Assistant
Powered by Claude. Knows your full projection, Monte Carlo percentiles, and the optimizer's phase-by-phase reasoning. Ask questions in plain English and get plan-specific, year-by-year answers, not generic advice.
Share your plan
Bring in a spouse, financial planner, or trusted family member, with full control over whether they can view, edit alongside you, or manage the plan as a professional.
Survivor scenarios
Model the full financial impact of a partner dying in any year: income adjustment, survivor SS benefit, life insurance payout, and survivor living expenses (configurable ratio, default 65%, OECD-aligned).
Annuities, pensions & military retirement
SPIA, DIA, fixed-term, variable, and joint-life annuities with COLA and exclusion ratios. Pensions with an independent start year, survivor benefit, COLA and vesting (years of service + hire year; the engine forfeits the pension if you retire before vested, and the optimizer scores it). Military retirement pay tracked separately from civilian pensions for state tax exemptions in ~37 states.
What-if scenario comparisons
Build and compare alternative strategies side-by-side: different retirement dates, spending levels, asset allocations, or Social Security ages. Custom glide paths with arbitrary breakpoints let you model a bond tent: de-risk into retirement, re-risk after. Includes one-click SS insolvency templates (24%, 28%, zero).
Life insurance gap analysis
Two measures per person from a full survivor projection: a solvency floor (the survivor never runs out of money) and a living-standard need that sizes coverage to preserve your household's per-person standard of living, based on the higher of planned or maximum-sustainable spending. Dashboard panel, Ask AI context, and PDF export. Variable Universal Life policies are recognized too: long-term-care rider coverage (daily benefit × years) and cash surrender value, shown alongside the gap.
Healthcare & ACA planning
ACA premium subsidy optimization, IRMAA surcharge 2-year lookback per person, Medicare Part B/D CPI projection with birth-month proration, HSA cascade rules, and long-term care premiums, all year by year.
§72(t) SEPP: retire before 59½
Reach a traditional IRA years early without the 10% penalty. All three IRS methods (required minimum distribution, fixed amortization, fixed annuitization) using the Single Life table from Pub 590-B and the mortality table from Treas. Reg. §1.401(a)(9)-9, with the 5% floor rate of Notice 2022-6. Size the commitment from the actual bridge need, and see what it costs you: the panel puts the penalty avoided against the ACA subsidy lost and the extra tax owed, side by side. Guardrails flag a shortfall year and check whether the rule of 55 would have done the job without the commitment, because a series that busts re-charges the 10% on every payment already taken.
RMDs, QCDs & tax-efficient draws
SECURE 2.0 age 73/75 trigger, per-person RMDs, QCD offset, and a configurable draw order (cash → bonds → brokerage → HELOC → trad IRA → Roth → HSA). A HELOC is drawn before retirement accounts since it carries no income tax or early-withdrawal penalty. Above your stock target, the draw takes stock ahead of bonds, so the money you were withdrawing anyway does the de-risking your glide path asks for. Capital loss carryforward (STCL + LTCL) offsets stock and property gains each year, then $3,000 of ordinary income. Want to override the algorithm? Pin an exact Trad IRA, Roth, or brokerage withdrawal for any year in a what-if scenario.
Debt & loan modeling
Car loans, student loans, and personal loans with optional extra-principal payments that accelerate payoff. A HELOC can sit alongside a mortgage as an active cash cushion, drawn in the withdrawal waterfall or tagged to fund a specific major expense (a new roof, say) directly. Reverse mortgages model the balance correctly: it grows instead of amortizing down, paying the owner tax-free, repaid from sale proceeds.
Nine ways to see your plan.
On-demand chart tabs alongside your projection, one click away and never cluttering the default view.
Net Worth & Cash Flow Overview
Net worth, cash on hand, taxes, and spending tracked to age 90+. Switch between nominal and today's dollars, layer Monte Carlo bands or What-If scenarios on top, and see every milestone and required action marked on the year it lands.
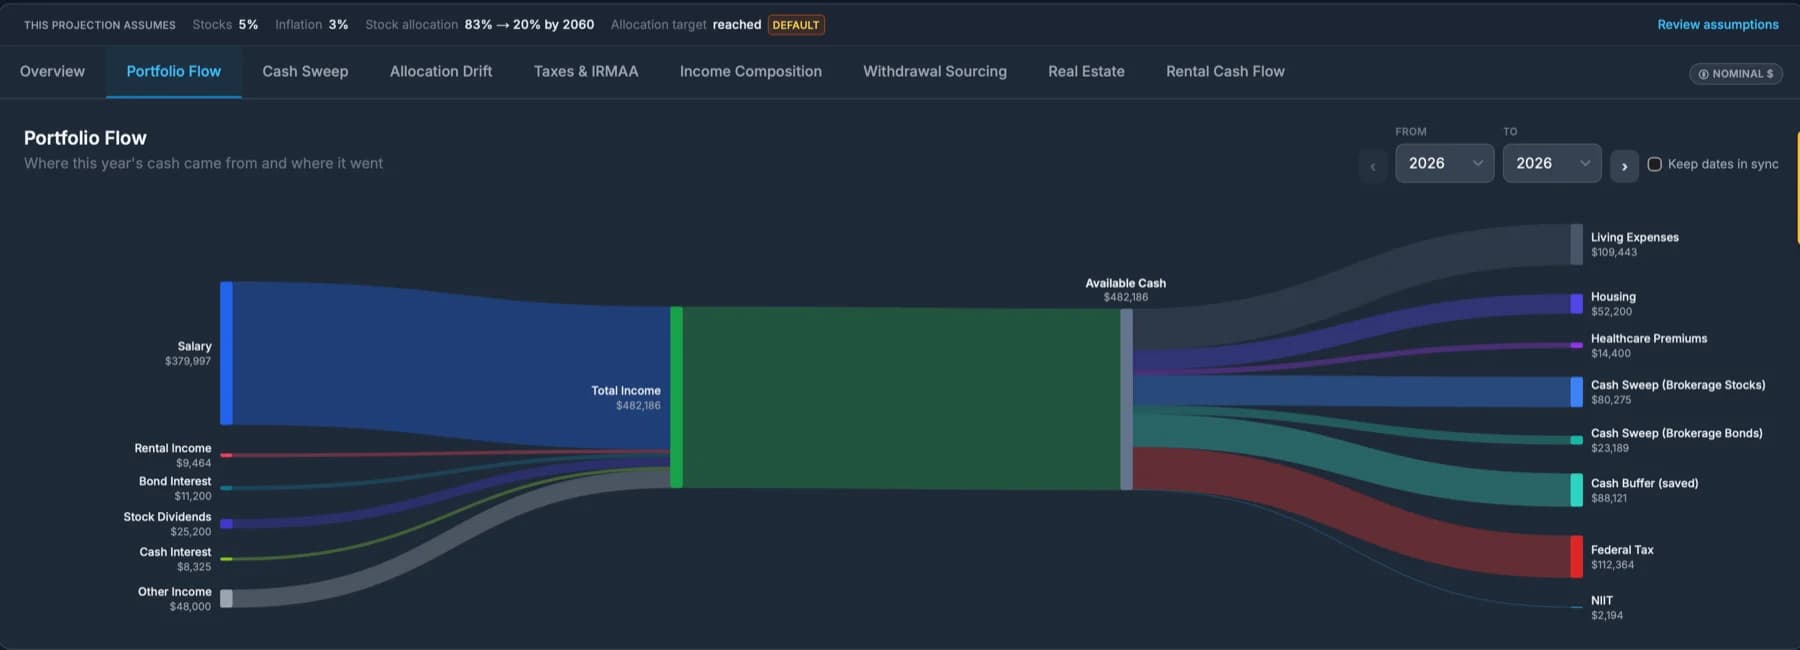
Portfolio Flow
An interactive Sankey diagram showing exactly where a year's (or any year range's) cash came from and where it went: every income stream and account draw flowing into spending, a Federal/State/penalty tax breakdown, and savings.
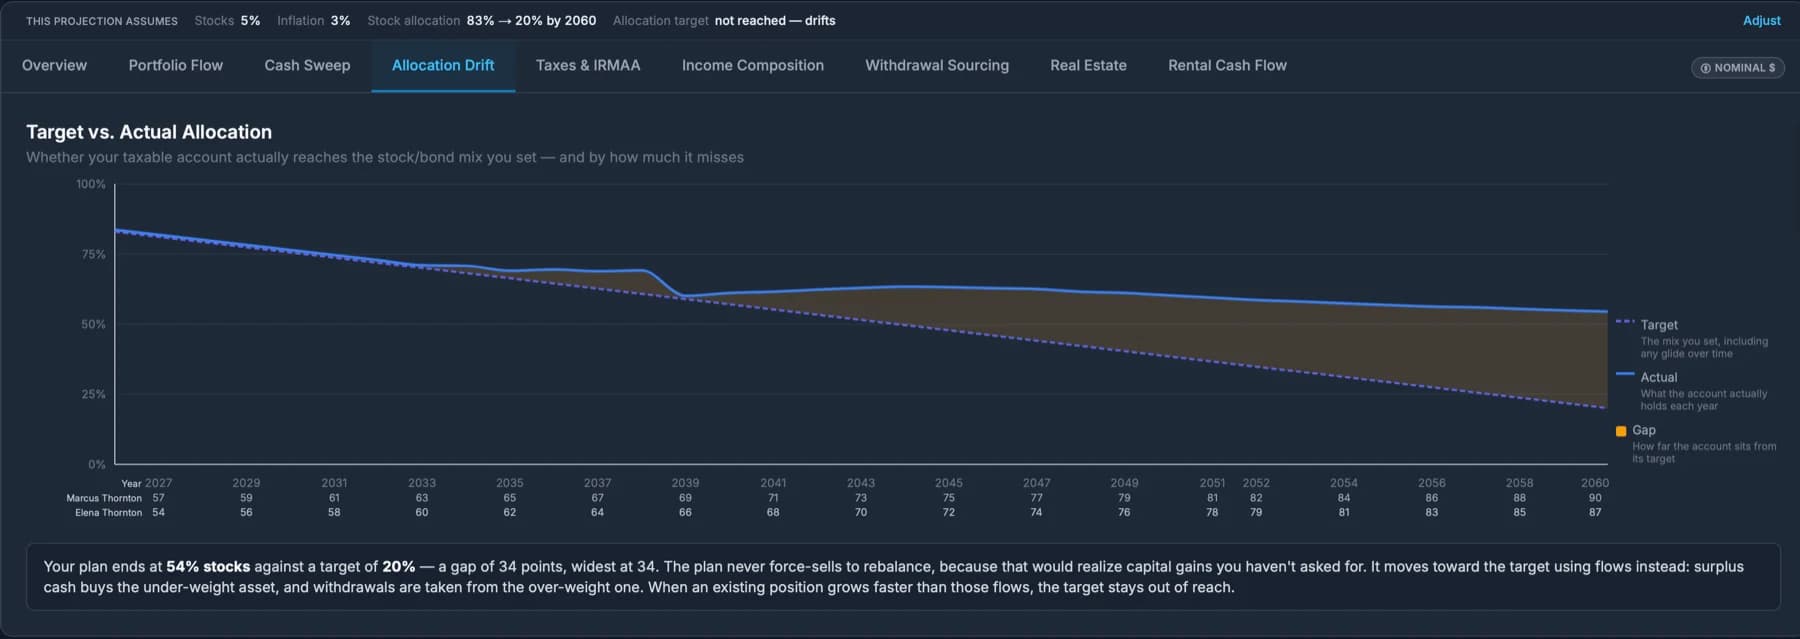
Allocation Drift
Target vs. actual: whether your taxable account really reaches the stock/bond mix you set, and by how much it misses, stated in plain words.
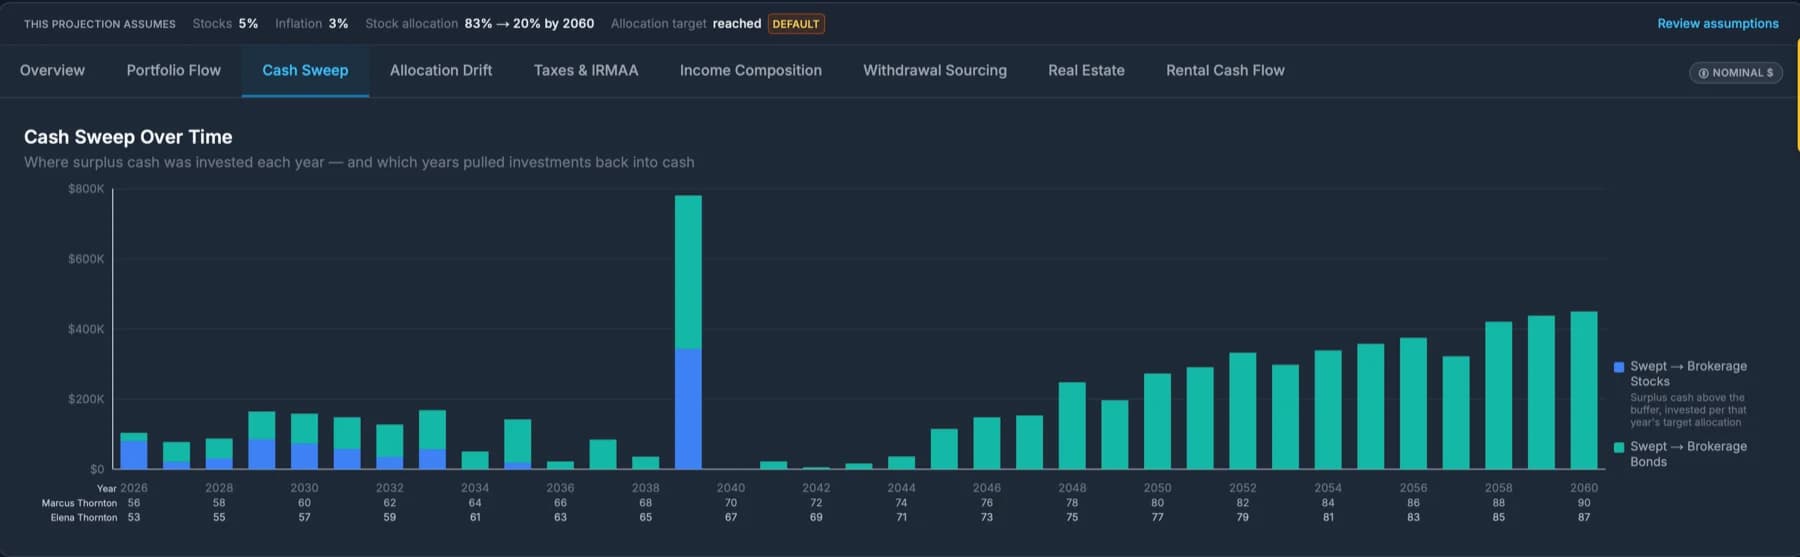
Cash Sweep
Where surplus cash went each year, swept into stocks or bonds at your target allocation, and which years pulled investments back into cash instead.
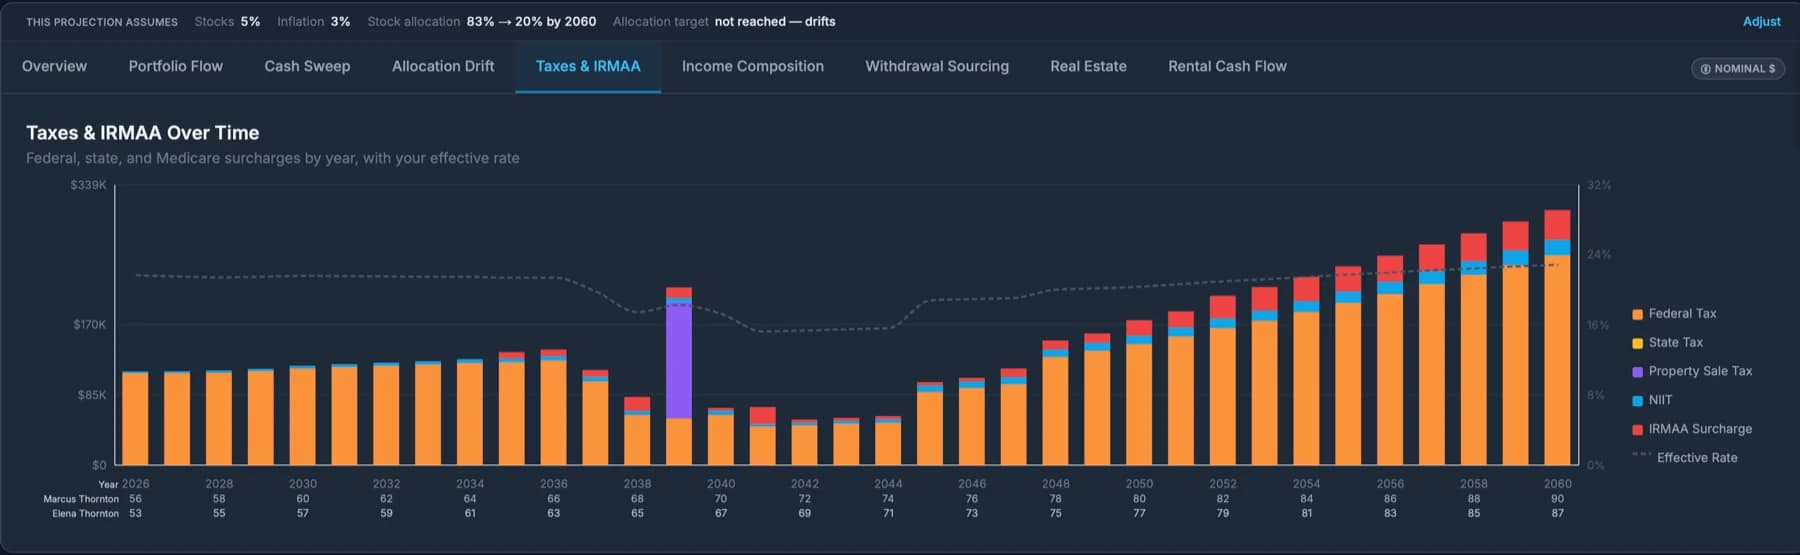
Taxes & IRMAA Over Time
Federal and state tax, NIIT, property-sale tax and IRMAA surcharges by year, with your effective rate overlaid so the cliffs show early.
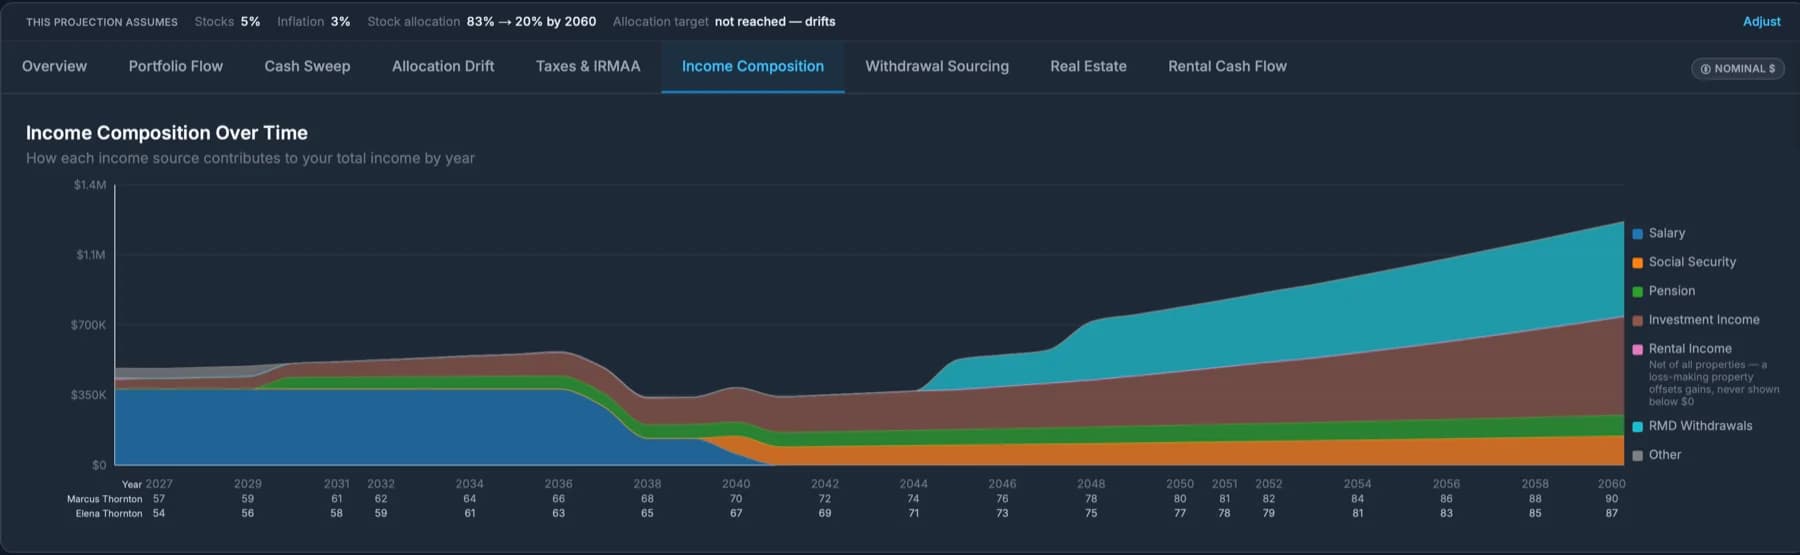
Income Composition
Every income stream stacked into one view: salary, Social Security, pensions, annuities, rent and RMDs. Watch your paycheck being replaced.
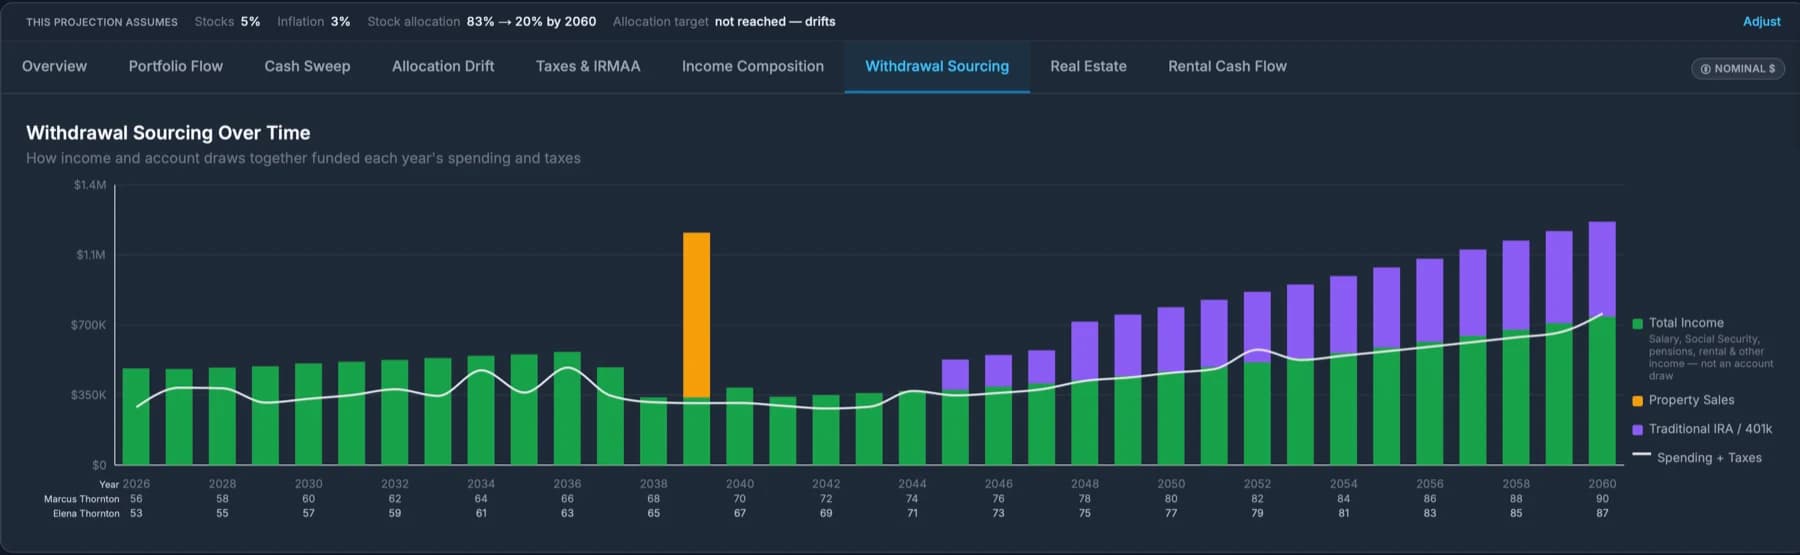
Withdrawal Sourcing
Your draw order in action: bonds and brokerage first, then a HELOC, then Traditional IRA, Roth and HSA, against income with spending overlaid.
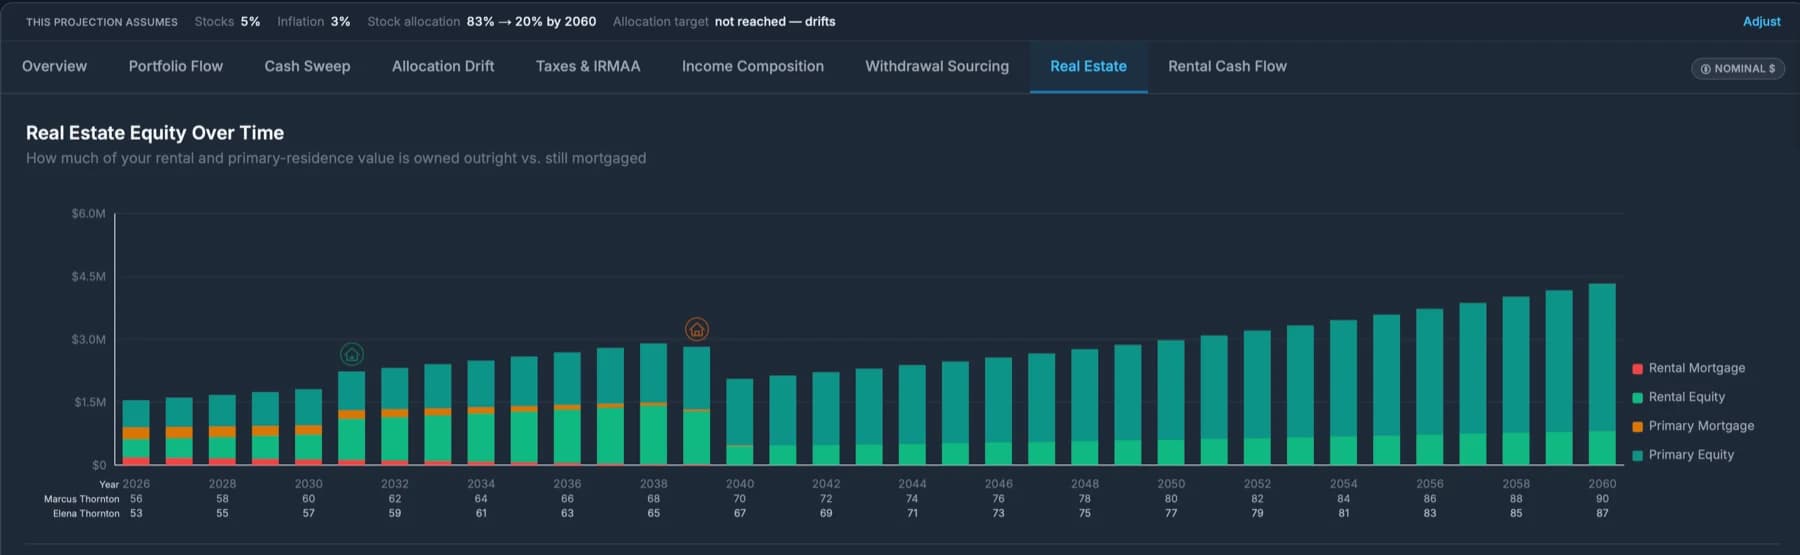
Real Estate Equity
Mortgage paydown and equity growth for every rental and residence, broken out separately, with purchase and sale milestones marked.
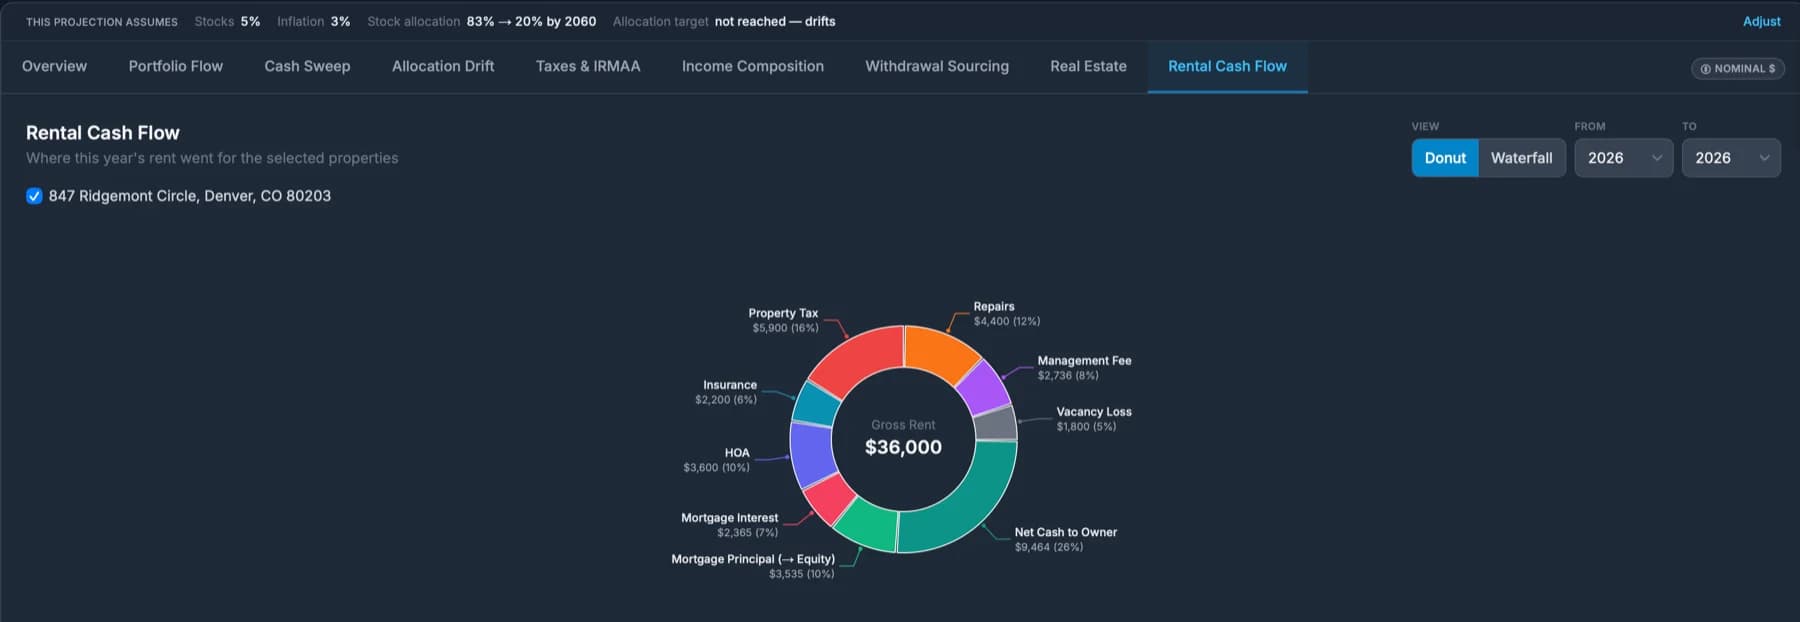
Rental Cash Flow
A per-property donut splitting gross rent into vacancy, fees, repairs, taxes, insurance and mortgage, with shortfall years called out.
A plan that tells you what to do, then checks that you did it.
NestEdge never moves your money. It produces the instruction list you work from, on your own or with an advisor, and it keeps asking whether the plan is still true.
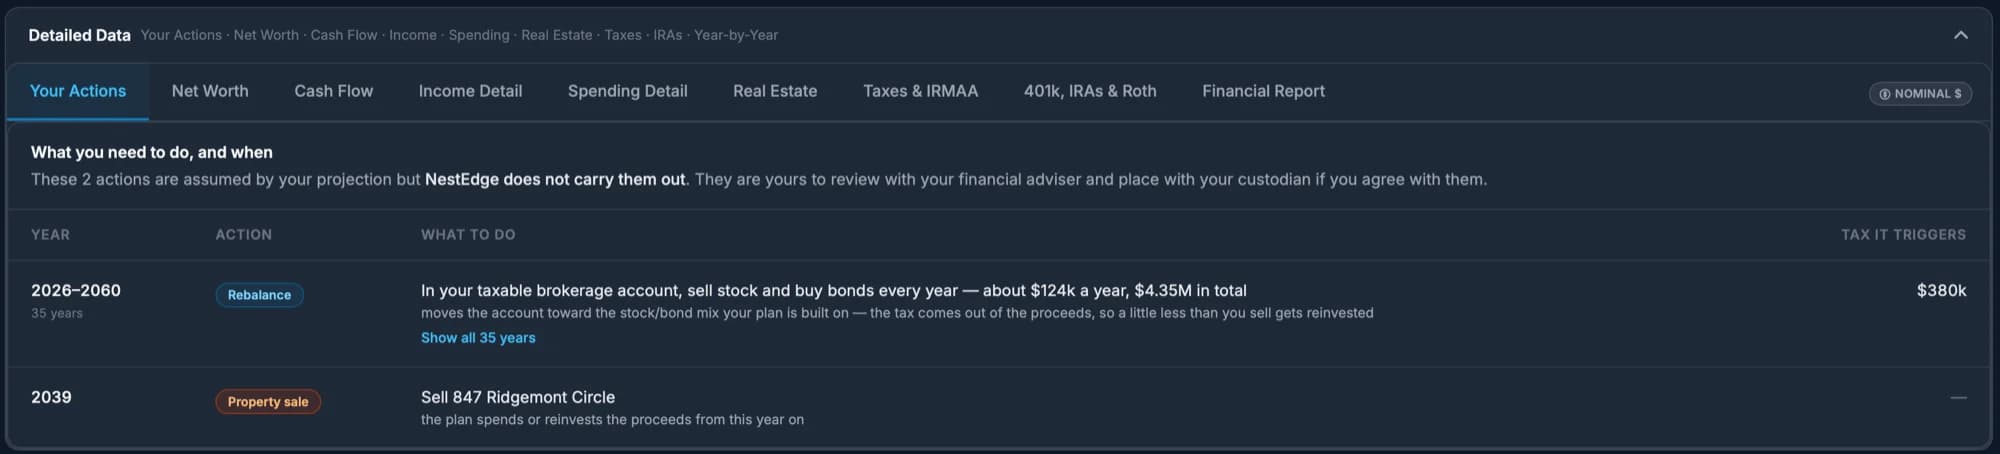
The action list
A projection is only worth what actually gets executed. Every action is listed with its year, its amount, the account it comes from, and the tax it triggers, marked on the charts at the year it occurs, and printed year by year in the report you work from.
- Rebalance: Sell stock, buy bonds, named per account and per year, with the tax the sale realises
- Roth conversion: How much to convert and in which years, against the bracket ceiling it was sized to
- Property sale: Which property, which year, and the gain, recapture and NIIT that follow
Multi-year campaigns are grouped the way you would actually act on them: one conversion programme, not twenty separate instructions. Each one opens to the individual years.
And it keeps watching
Plans go stale in two different ways, so NestEdge checks for both.
Is this still true?
Five vitals, covering portfolio, spending, income, property and health cover, each carry their own cadence. When one ages past it, the plan says so instead of quietly projecting from a number you last touched two years ago.
Did it actually happen?
The harder one. If your plan assumed a rebalance began in 2029 and nobody made the call, nothing looks stale. Every balance can be freshly confirmed and accurate while the legacy figure above them rests on a trade that was never placed. So the plan asks.
Your plan assumed a rebalance started in 2029. Did that happen?
Working through a firm? The same alerts surface on your planner's dashboard, per client, so a plan drifting from its own instructions is visible on both sides, not just yours.
The scenarios that matter, all modeled.
Generic planning tools skip the hard parts. Here's exactly what NestEdge covers.
- ✓All 81 claiming combinations (primary × spouse, age 62–70), ranked by net legacy (heir-tax-aware estate value) + longevity/survivor insurance value
- ✓Earnings Test: withheld benefits returned as Adjustment of Reduction Factor (higher future checks, correctly modeled)
- ✓RIB-LIM cap when both spouses delay, preventing double-counting of delayed credits
- ✓Delayed Retirement Credits applied month by month with birth-month precision
- ✓Survivor benefit in both directions: income, SS survivor check, life insurance payout, expense adjustment
- ✓WEP and GPO fully removed per Social Security Fairness Act (signed January 2025)
- ✓Trust-fund insolvency scenarios: CBO 28% cut, Trustees 24% cut, zero-SS, all one click from the scenario panel
- ✓SSDI (disability): full PIA with no early-claiming reduction, exempt from the trust-fund haircut while on disability, converts seamlessly to a retirement benefit at Full Retirement Age
- ✓Backdoor Roth IRA: IRS pro-rata rule (Form 8606), per-person pre-tax IRA basis, so a spouse's clean backdoor stays clean
- ✓Mega backdoor Roth: after-tax 401(k) sub-account, basis/earnings split, §415(c) total-additions awareness
- ✓Bracket-ceiling Roth conversion optimizer: window-schedule-aware, front-loaded vs. uniform pacing across retirement
- ✓IRMAA torpedo zone: 2-year lookback, per-person MFJ + single brackets, surcharge projected year by year
- ✓State income tax with per-state exemptions for SS, civilian pensions, military retirement, and RMDs in 37+ states
- ✓Asset location: bonds compound untaxed in a Traditional IRA while stocks stay taxable for favorable treatment, and the optimizer now picks that placement for you, holding your overall stock/bond split fixed so the gain is tax efficiency, not hidden risk
- ✓Reaching that mix, not just naming it: cash and the withdrawals you were making anyway rebalance for free, leftover drift is sold in the taxable account, and the optimizer prices the pace, because all at once and spread over years are different tax bills
- ✓Capital loss carryforward (STCL + LTCL chains) offsets stock AND property sale gains, then $3,000/yr of ordinary income. QCDs, RMD age 73/75 (SECURE 2.0), Roth 5-year clock
- ✓Early withdrawal penalty with age 59½ and birth-month precision; Roth earnings vs. basis correctly split
- ✓§72(t) SEPP: all three methods, duration set to the LATER of five years or age 59½, and the committed sub-account carved out of the drawdown waterfall so nothing else can reach it
- ✓A 72(t) already in progress can be recorded on the plan itself, not just modelled: the payments, the tax on them, and their effect on ACA and IRMAA all flow through the projection
- ✓Rental properties: MACRS depreciation, §1250 recapture, LTCG, NIIT, §1031 like-kind exchange with boot calculation for partial and N→M multi-property exchanges, optimizer sale timing
- ✓Property tax portability: CA Prop 19, FL Save Our Homes, TX Over-65 school ceiling, SC §12-37-3135
- ✓Appreciation is set per property, not once for the whole plan, and can be negative, so a market you expect to fall is modelled as falling
- ✓Pension vesting: years-of-service + hire year; optimizer forfeits pension if retiring before vested
- ✓Military retirement pay tracked separately from civilian pension for ~37-state state tax exemption
- ✓HELOC as an active funding source: drawn in the withdrawal waterfall before retirement accounts, or tagged to fund a specific major expense directly
- ✓Reverse mortgages: balance grows (compounds + payout) instead of amortizing down, paying the owner tax-free, repaid from sale proceeds
- ✓Extra monthly principal on any mortgage or loan accelerates payoff, and is reflected in every balance, equity and cash-flow projection
- ✓Life insurance gap analysis: per-person solvency floor plus a living-standard need that preserves the survivor's per-person standard of living, based on the higher of planned vs. maximum-sustainable spending; VUL policies' LTC rider coverage and cash surrender value recognized alongside it
- ✓HSA: individual and family accounts per person, with the shared family limit and catch-ups; post-65 non-medical cascade taxed as ordinary income; Medicare enrollment cutoff enforced per person
- ✓Still working, already retired, or never drew a salary: each person is modelled on their own footing, so a retired spouse never gets phantom 401(k) contributions or a retirement date they have already passed
- ✓Runway rescue: when the optimized plan still runs out, eight drastic levers are measured on your plan, from spend less (and how much) to sell the home and rent, each with the year it buys, and a Safe to spend ceiling in today's dollars
- ✓ACA: month-range premium entry, IRMAA interaction, Medicare Part B CPI projection with birth-month proration
From details to optimized plan in minutes.
Enter your details
Salaries, pensions, Social Security, annuities, real estate, expenses and insurance, whether you are still working, already retired, or one of you never drew a salary. Answer a guided interview one question at a time, or fill in the full form if you know your numbers. About 10 minutes either way.
See your baseline plan
A year-by-year projection appears instantly. Nominal or today's dollars. Insights surface depletion risk, IRMAA exposure, and Roth conversion windows automatically.
Optimize and stress-test
Run the Optimizer for the best Social Security, Roth, property-sale, and asset-location strategy. Stress-test with Monte Carlo and backtest against real market history back to 1928, under your advisor's bucket method if you use one. Compare alternatives side-by-side. If the plan still runs out, see exactly which hard choices would fix it, and by how many years.
Export and share
Download the full report to work from yourself, review with an advisor, or share the plan directly for collaboration.
Budgeting & Expenses:
know exactly what you spend.
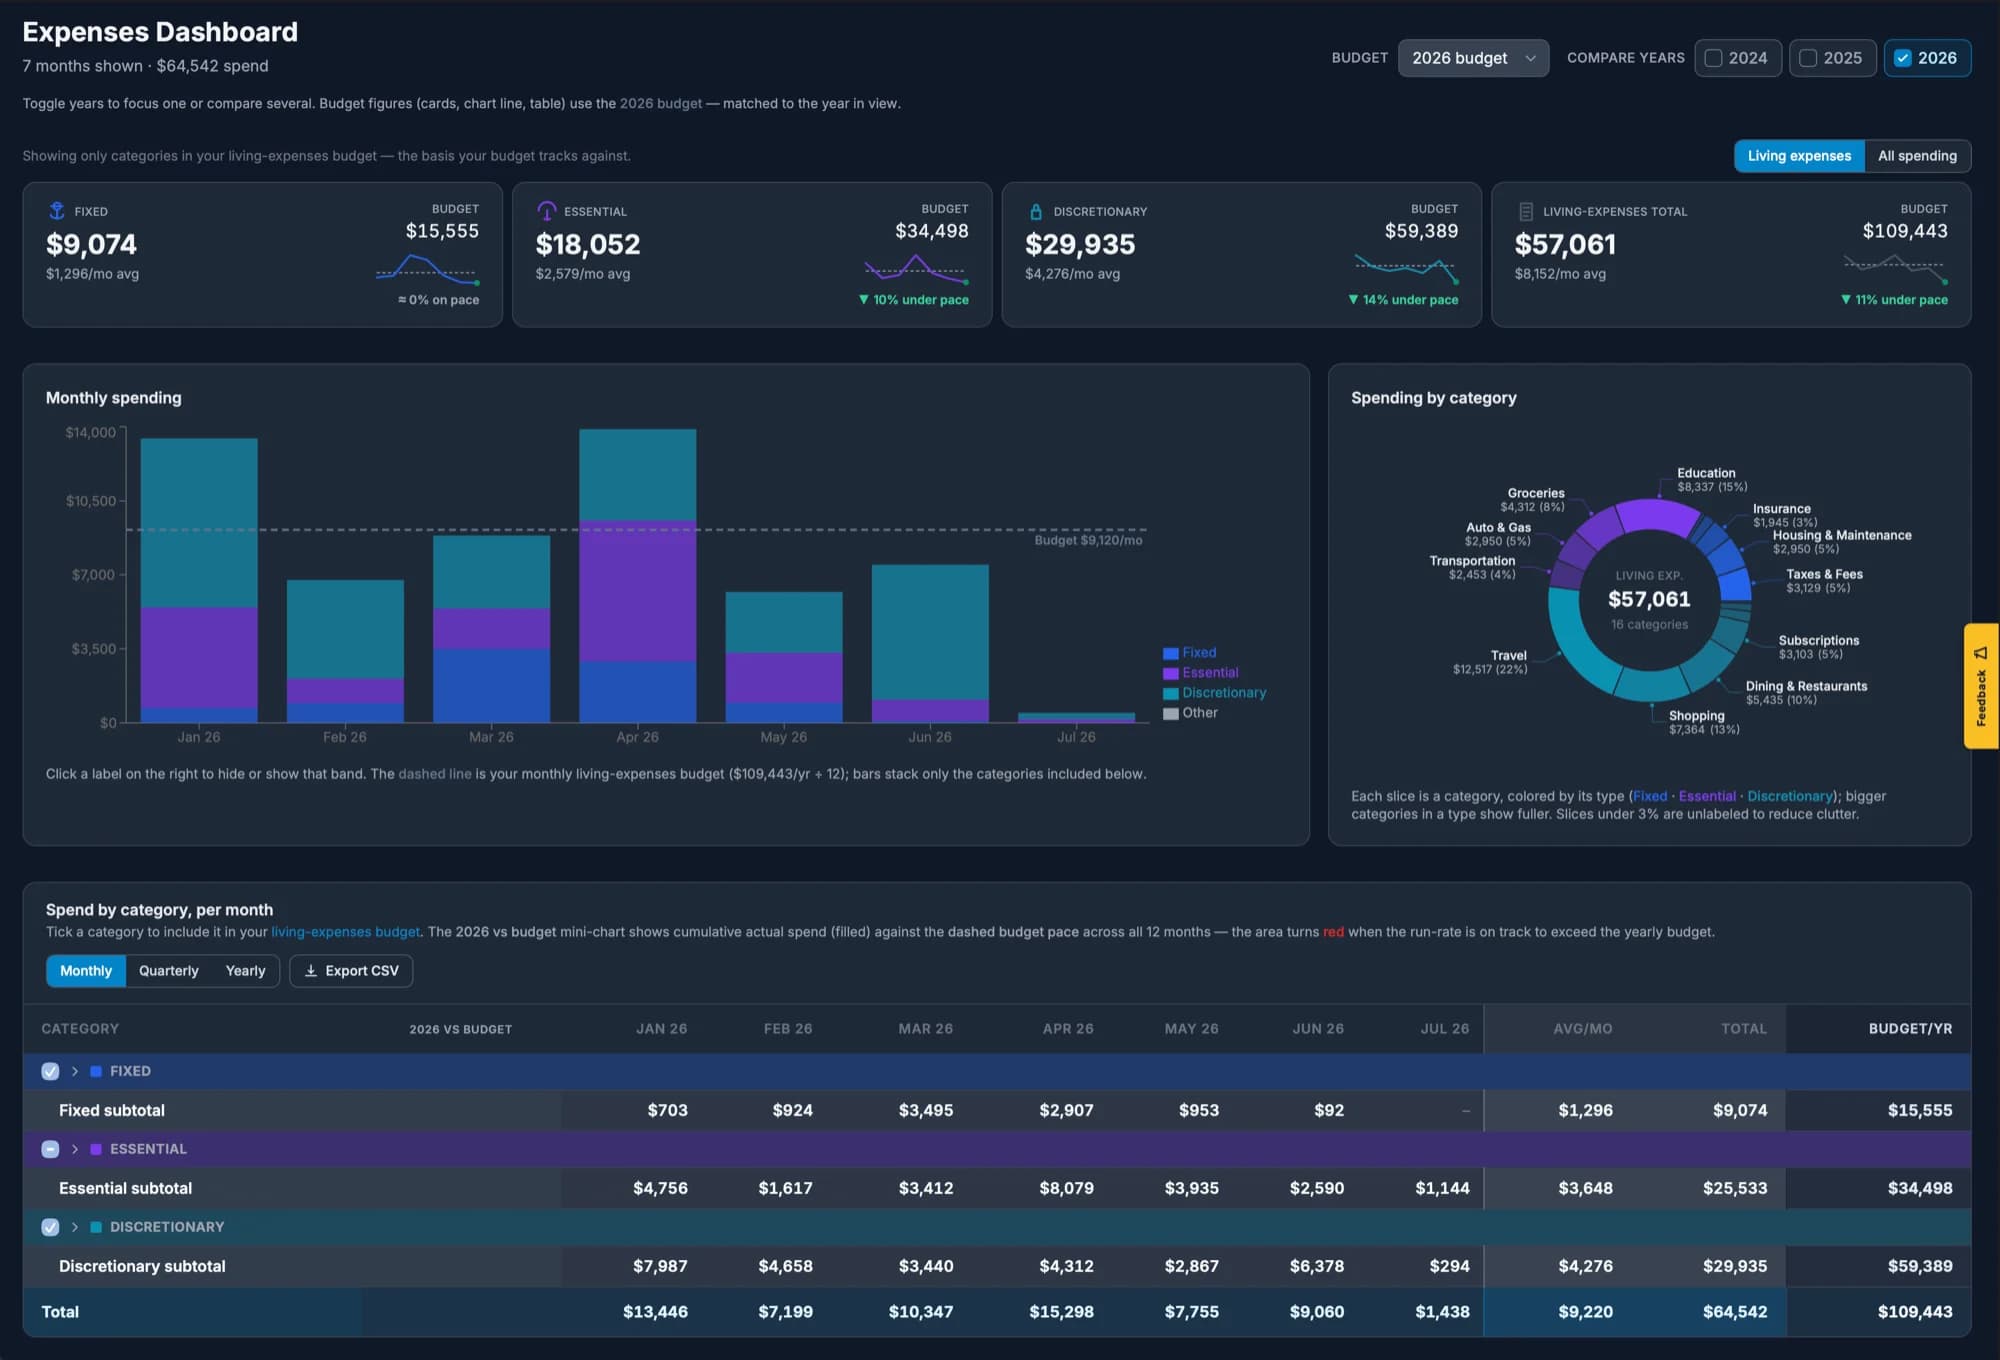
Most financial plans start with a guess: “what do we spend a year?” NestEdge's Budgeting & Expenses module replaces that guess with your real numbers. Upload your bank and credit-card statements and it does the rest, then hands a defensible living-expenses figure straight to your plan.
Upload real statements
Drop in PDFs, CSVs, or photos of bank and card statements. Transactions are read and de-duplicated automatically, with no manual entry.
Auto-categorized spending
Every transaction is sorted into fixed, essential, and discretionary buckets you control, with an Ignore bin for transfers and reimbursements.
Track against budget
A dashboard shows each category's spend versus budget and whether you're trending over or under, month by month.
Feeds your retirement plan
Roll your real spend into an annual living-expenses budget and pull it directly into the planning wizard, and the two modules stay in sync.
Reconcile against your plan
One click compares your plan's spending assumption against your real budget, nets out what the plan already models separately, and lets you adopt the reconciled figure as a scenario, so your plan is grounded in what you actually spend.
Ask your plan
anything.
The AI Chat Assistant knows your full projection: Monte Carlo results, optimizer reasoning, and year-by-year details. Ask in plain English and get a direct, plan-specific answer.
- ›“What's the difference between my base plan and the Monte Carlo median at age 80?”
- ›“Why did the optimizer suggest claiming Social Security at 62?”
- ›“How does our plan change if we retire two years earlier?”
What's my success rate if markets average 4% in my first decade?
With a 4% equity return for 2026–2036, your Monte Carlo success rate drops from 87% to 71%. The P10 net worth at 90 falls to $940K. The Optimizer's scenario analysis suggests increasing your cash buffer to 3 years to absorb the sequence risk.
What's the cheapest fix to get back above 85%?
Delaying Social Security to 67 (from 62) adds $189K in present-value longevity insurance and pushes success back to 88%, more effective than reducing spending in the short term.
Pricing
Two plans. One clear upgrade path.
Both plans start with a 14-day free trial with full access. No credit card required.
Core
$99 billed annually, save 17%
- Complete wizard: household, income, annuities, expenses, portfolio, real estate, taxes
- Year-by-year projections to age 90+
- Survivor scenarios: death modeling with life insurance payout
- AI Chat Assistant: ask questions about your plan in plain English
- PDF + CSV export: professional reports to share with advisors
- Up to 3 saved plans
- Optimizer (10,000+ scenarios)
- Monte Carlo simulation
- Compare Alternatives
- Life insurance gap analysis
- Budgeting & Expenses module
Premium
$169 billed annually, save 22%
- Everything in Core
- Optimizer: 10,000+ strategy combinations across SS timing, Roth, property sale
- Monte Carlo: 1,000 simulated futures with success rate and probability fan
- Compare Alternatives: side-by-side scenario modeling
- Life insurance gap analysis: coverage need sized from your survivor projection
- Budgeting & Expenses module: upload statements, auto-categorize spending, build your living-expenses budget
- Up to 10 saved plans
Lifetime access: $499 one-time
Full Premium access, forever. No recurring subscription.
Just need one answer? Day pass: $3 for 24 hours
The Optimizer, Monte Carlo, historical backtesting, Compare Alternatives and the life-insurance gap analysis, for one day. One-time payment; it doesn't renew.
Not included: Ask AI, PDF & CSV downloads, and the Budgeting & Expenses module. Your saved-plan limit stays the same. Limit 4 passes per month.
Included on every plan
Mid-wizard paywalls kill plans. Your complete financial picture (wizard, projections, export, AI chat) is there from the cheapest plan up. Premium adds the tools that tell you how to improve the plan. The one-off day pass is narrower; see below.
Every feature, side by side
The full financial picture (modeling, tax strategy, real estate, AI, sharing, and lifecycle monitoring) is the same in Core and Premium. Premium adds the tools that search for and stress-test the best strategy, plus the standalone Budgeting & Expenses module.
| What you get | Core | Premium |
|---|---|---|
A complete financial household, modeled Salaries, pensions, Social Security, annuities, real estate, deferred compensation, expenses, and portfolio, all in one guided wizard. | ||
A 35+ year future, projected to the dollar Net worth, cash flow, taxes, and spending charted every year from today through age 90+, in nominal or inflation-adjusted dollars. | ||
NestScore: your plan's vital signs at a glance The moment you finish the wizard, before running a single simulation, your plan is rated on a five-tier scale from “Bare” to “Soaring.” | ||
Every Social Security claiming strategy you could choose All 81 combinations of claiming ages for you and your spouse, scored against your real numbers, with delayed retirement credits to the month. | ||
Survivor protection built in, not bolted on Model exactly what happens if a spouse passes away in any given year: survivor SS benefit, life insurance payout, and adjusted household expenses. | ||
Backdoor and mega backdoor Roth, done right The IRS pro-rata rule, after-tax 401(k) sub-accounts, and per-person basis tracking handled automatically, with conversions suggested when you're eligible. | ||
Executive-level deferred compensation support NQDC and §409A payouts modeled with correct tax treatment, including the income tax due, FICA already accounted for at deferral (never double-counted), and the 20% excise-tax risk on a plan-modification violation. | ||
Real estate without the guesswork Rental depreciation, §1250 recapture, and capital gains; full §1031 like-kind exchange support; property-tax protections in CA, FL, TX, and SC. | ||
Every state's tax rules, built in All 50 states + DC, with the exact rules for how each taxes (or exempts) Social Security, pensions, military retirement pay, and RMDs. | ||
Healthcare costs, demystified IRMAA surcharge thresholds, ACA marketplace subsidy optimization, HSA rules, and long-term care premiums, projected alongside your income. | ||
RMDs and charitable giving, optimized automatically Required minimum distributions at the SECURE 2.0 ages (73/75), QCDs routed to offset them, and a tax-efficient account draw order. | ||
A financial advisor in your pocket, day or night Ask plain-English questions and get answers grounded in your real numbers, your real simulations, and your real optimizer results. | ||
Take it with you A presentation-ready PDF report for a human advisor, plus every dashboard table exportable to CSV for your own analysis. | ||
Bring in the people who matter Share your plan with a spouse, planner, or family member, with full control over whether they can view, edit alongside you, or manage it. | ||
Your plan never goes stale: we watch it for you Every January 1st, your numbers refresh with the latest SS COLA, IRMAA thresholds, and IRS contribution limits, with a summary of what changed. | ||
Birthday emails that are actually useful Automatic alerts at 59½ (penalty-free access), 62 (SS eligibility), 63 (sets future Medicare premiums), 65 (Medicare enrollment), and before your first RMD. | ||
A once-a-year nudge that could be worth thousands Every December, exactly how much more you can convert to Roth before tipping into a higher bracket, calculated against your specific plan. | ||
We notice when the market does If equities move ±15% from your last simulation, we flag whether your plan's odds of success have meaningfully changed. | ||
A 10,000-scenario strategist working for you The Optimizer tests every SS claiming age, Roth conversion pace, and property-sale timing against your numbers and returns the best combination. | ||
The exact Roth conversion to make, every year A year-by-year conversion schedule calculated to sit at the edge of your optimal bracket without tipping into IRMAA surcharge territory. | ||
1,000 simulated futures, so you're never relying on one guess Full market-uncertainty stress-testing: a realistic range of outcomes and the probability your plan actually survives. | ||
Backtest against a century of real market history Replay your plan through every real retirement start year back to 1928 (the Depression, 1970s stagflation, 2000, 2008) with actual stock, bond, and (optionally) inflation sequences. See how often your plan would have survived, and compare it against any single year you choose. | ||
Side-by-side “what if” strategy comparisons Retire two years earlier, spend 10% more, change your asset mix, then see the consequences next to your current plan before you decide for real. | ||
Know your life insurance number, not a guess A precise coverage calculation based on your actual income, mortgage, and living expenses if you weren't there tomorrow. | ||
Budgeting & Expenses: your real spending, categorized A standalone module: upload bank and card statements, auto-categorize transactions into fixed, essential, and discretionary spending, and build a defensible annual living-expenses budget that flows straight into your retirement plan. | ||
Reconcile your real spending against your plan One click compares your plan's living-expenses assumption against your actual budget, nets out what the plan already models separately (healthcare, housing, education, one-time spikes), and lets you adopt the reconciled number as a scenario, so your plan is grounded in what you truly spend. | ||
Saved plans Active financial plans you can keep at once. | 3 | 10 |
Price | $9.99/mo or $99/yr | $17.99/mo or $169/yr |
Common questions
What does NestEdge actually do?
It searches for your best retirement strategy, rather than only projecting the one you type in. Enter your household once and NestEdge runs a seven-phase optimizer over 10,000+ combinations: retirement date, all 81 Social Security claiming pairs, how much to convert to Roth and how fast, charitable QCDs, when to sell a rental, and which of your accounts should hold the stocks and which the bonds. It then stress-tests the result against 1,000 Monte Carlo futures and every real market sequence back to 1928. If the plan still runs dry it says so, and quantifies the fixes: spend this much less, retire this much later, downsize, take a reverse mortgage.
Do I need a financial advisor to use NestEdge?
No. NestEdge is built to be used on your own, start to finish, and most people do. It produces an instruction list (sell this much, convert this much, in this year, from this account) because a projection is only worth what actually gets done, and that list is equally useful whether you execute it yourself or hand it to someone. NestEdge never moves your money, and it does not sell you a wealth-management relationship.
Does NestEdge connect to my bank accounts?
No, and that is a deliberate design choice rather than a missing feature. A retirement projection runs on balances, contribution rates and assumptions, not on a live transaction feed, so a daily sync adds a standing security exposure without improving the answer. You enter your accounts once and revisit them when something changes. If you want your real spending in the picture, the Budgeting module imports a bank or card statement and reconciles it against your plan's living-expense assumption in one click.
Is there a permanent free tier?
No, and that is deliberate. A free tier attracts users who won't pay, creates disproportionate support load, and signals that the tool isn't serious. A 14-day full-access trial is offered to new users. When the trial ends, your plan data is kept safe in your account; you just need an active plan (or a $3 day pass) to open it again.
What happens after my trial?
Your plan data is preserved indefinitely. We never delete it, and you can come back to it at any point. But viewing and running plans needs an active subscription, so until you choose Core or Premium (or buy a $3 day pass) the plans themselves stay locked. Signing in always works; you pick up exactly where you left off the moment you subscribe.
Why is AI Chat in Core, not Premium?
The chat assistant reduces confusion. It's what makes users stick, not what makes them upgrade, and gating it behind Premium would undermine the most differentiated feature NestEdge has.
Can I upgrade or downgrade at any time?
Yes. Upgrade to Premium at any time and the prorated difference is charged immediately. Downgrade takes effect at the next billing cycle. If you cancel outright, your plans are kept but locked until you subscribe again or buy a day pass. Nothing is deleted.
What is the Lifetime option?
One-time payment of $499 gets you full Premium access with no recurring subscription, ever.
What is the $3 day pass?
A one-time $3 payment that unlocks the Premium analysis tools for 24 hours: the Optimizer, Monte Carlo, historical backtesting, Compare Alternatives, and the life-insurance gap analysis. It does not renew and it is not a subscription. It's for the moment you want to answer one specific question ("should I convert to Roth this year?") without committing to a monthly plan.
What is NOT included in the day pass?
Three things, and they're the reason the pass is $3 rather than a month's subscription: Ask AI, PDF and CSV downloads, and the Budgeting & Expenses module. You can see every optimizer result and simulation on screen for the full 24 hours, but you can't export them, and the budgeting module needs more than a day to set up anyway. Your saved-plan limit also doesn't change. If you want to keep, export, or discuss the results, that's what a subscription is for.
What devices does NestEdge work on?
NestEdge runs in any modern browser: desktop, tablet, or phone. It's built for desktop and tablet screens, where there's room to see your full plan at a glance. It works on a phone too, but a retirement plan carries a lot of detail (tables, charts, the optimizer), so the experience is more cramped on a small screen.
Work with an advisor? It fits there too.
NestEdge is built to be used on your own, and most people do. If you also work with someone, nothing has to change. Export the full report: projections, income year by year, IRMAA and bracket warnings, your action plan, and every setting the plan runs on, plus optimizer and Monte Carlo analysis once you have run them. An advisory session then starts from evidence rather than from scratch.
Inside it: every year of every action the plan depends on, with the amount and the tax it realises. That is a page an advisor can work from without rebuilding anything. The Share feature also lets them view and collaborate on the plan directly.
And the plan can run the way your advisor manages money. A two-bucket or three-bucket approach is a setting, not a spreadsheet on the side: the projection keeps the spending buckets at their size, refills them by the rule your advisor uses, and shows it year by year. A firm can make its method the default for every client plan it hands over.

Start your free trial today.
14 days, full access, no credit card.
See what a genuinely complete financial plan looks like.
No credit card · Cancel any time · Your data is never sold or shared